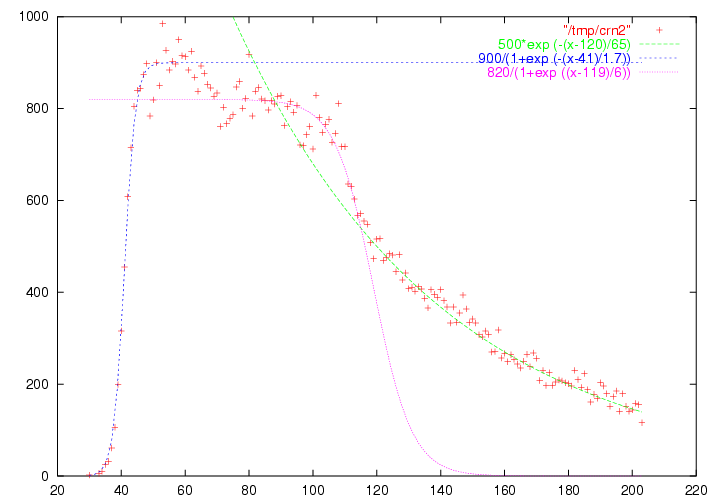
On 2001-08-08 11:13:16 +0200, Patrick Oonk wrote:

>http://www.security.nl/misc/codered-stats/

Your code red II curve is indeed a bit weird...  This is most
probably due to the "locality" properties of Code Red II: You should
see a strong effect whenever it hits somewhere in your "/8"
neighborhood, and an even stronger effect when spreads in "your
/16".  That is, local measurements are likely to give biased results
with CR II.


However, what I find much more interesting is the behaviour of your
Code Red I graph at the point at which CR II occurs.  Assuming that
the number of susceptible machines still changes slowly, this is
just the number of machines NOT infected with CR II.  Thus, if CR II
is following a logistic growth law, we should be seeing a logistic
curve turned on its head.

Let's fit some curves, see <http://www.does-not-exist.org/worm.png>;
these are based on your numbers: The first hours of worm growth are
described by a logistic curve (the blue dashed line).  Then, we see
some decay which is most likely due to users patching their hosts.
This is what we should expect.

But then things get interesting: We can fit a logistic curve (the
pink dotted line) into the behaviour between (approximately) hours
96 and 114 (that is, August 4 between 0:00 and 18:00), but then the
behaviour of the CR I decay curve then turns exponential quite
suddenly (the dashed green line) - in a way which is certainly not
compatible with the current model.

The reason for this is most likely the forcible reboot of CR II
servers after 24 hours.  That does, in particular, mean that the
first wave of CR II infections probably started at approximately
18:00 +0200 on August 3.

Properly describing this behaviour with a mathematical model will be
a bit more tricky since this behaviour contains non-local effects
(that is, it depends on the history of the infection and not just on
the current number of infected hosts).

--
Thomas Roessler                        http://log.does-not-exist.org/

----------------------------------------------------------------------------
This list is provided by the SecurityFocus ARIS analyzer service.
For more information on this free incident handling, management
and tracking system please see: http://aris.securityfocus.com
This archive was generated by hypermail 2b30 : Wed Aug 08 2001 - 11:08:46 PDT